 FeedBurner
 Feedly
 BlogWith2
 rss2json
 RSS.app
 FreshRSS
 Bloglovin
 FeedWind
Sales outreach
All 647 of these sites already run KitchenAid, with the food and beverage services segment leading at 6 sites. Pitch the products and services that fit that exact stack.
Type at least 2 letters
KitchenAid produces kitchen appliances and tools that include inspiring recipes and helpful tips to improve your cooking experience and culinary adventures.
Up to 1M sites per list · Segment by country & TLD to cover the full footprint · Unlimited report rebuilds for 1 month
“Top websites” means each year's top 1 million websites, unless stated otherwise. Click on to share.
And 28 more countries in the full dataset.
Need every KitchenAid site in one market? Unlock KitchenAid once and rebuild filtered reports as often as you like for a month: by country, TLD, or stack combination, each with up to 20 data points per site.
Start from $39/moShare of the top websites
| Crawl | Top 1 million | Websites in the crawl | Change from previous crawl | Share of top 1 million |
|---|---|---|---|---|
| September 2008 | 0% | 0 | First year on record | 0% |
| February 2010 | 0% | 0 | First year on record | 0% |
| April 2012 | 0.01% (91) | 322 | First year on record | 0.01% |
| June 2013 | 0.02% (108) | 490 | +76.2% | 0.02% |
| December 2013 | 0.02% (109) | 445 | −3.1% | 0.02% |
| April 2014 | 0.01% (83) | 418 | −28.1% | 0.01% |
| October 2014 | 0.01% (78) | 387 | −3.1% | 0.01% |
| April 2015 | 0.02% (98) | 433 | +26.4% | 0.02% |
| October 2015 | 0.03% (116) | 536 | +41.7% | 0.03% |
| May 2016 | 0.02% (107) | 639 | −10.8% | 0.02% |
| October 2016 | 0.02% (179) | 1,492 | −4.2% | 0.02% |
| April 2017 | 0.02% (124) | 1,688 | −21% | 0.02% |
| October 2017 | 0.04% (252) | 2,388 | +123.6% | 0.04% |
| April 2018 | 0.03% (187) | 1,981 | −28.7% | 0.03% |
| October 2018 | 0.03% (195) | 1,875 | −0.3% | 0.03% |
| April 2019 | 0.03% (212) | 1,995 | +10.2% | 0.03% |
| October 2019 | 0.03% (189) | 1,960 | −3.7% | 0.03% |
| April 2020 | 0.02% (120) | 1,830 | −36.5% | 0.02% |
| October 2020 | 0.02% (135) | 1,690 | +14.4% | 0.02% |
| April 2021 | 0.03% (172) | 1,457 | +24.4% | 0.03% |
| October 2021 | 0.02% (105) | 1,267 | −38.1% | 0.02% |
| May 2022 | 0.02% (103) | 1,026 | −4.8% | 0.02% |
| October 2022 | 0.01% (77) | 914 | −17% | 0.01% |
| March 2023 | 0.01% (61) | 781 | −23% | 0.01% |
| September 2023 | 0.01% (87) | 726 | +41.1% | 0.01% |
| April 2024 | 0.01% (60) | 634 | −28.4% | 0.01% |
| October 2024 | 0.01% (45) | 528 | −22.3% | 0.01% |
| April 2025 | 0.01% (57) | 484 | +33.5% | 0.01% |
| October 2025 | 0.01% (29) | 423 | −50% | 0.01% |
| October 2026 · Live crawl | 0% (5) | 647 | First year on record | 0% |
Each point is one crawl and shows the share of the top websites where KitchenAid was detected; the dotted line is the overall trend. Hover over or tap the chart for details.
| Year | Gained | Dropped | Net change |
|---|---|---|---|
| 2026Live crawl | 61 | 112 | −51 |
| 2025 | 19 | 167 | −148 |
| 2024 | 40 | 218 | −178 |
| 2023 | 31 | 269 | −238 |
| 2022 | 41 | 352 | −311 |
| 2021 | 100 | 472 | −372 |
| 2020 | 320 | 525 | −205 |
| 2019 | 470 | 510 | −40 |
| Year | Gained | Dropped | Net change |
|---|---|---|---|
| 2018 | 631 | 683 | −52 |
| 2017 | 777 | 473 | +304 |
| 2016 | 615 | 266 | +349 |
| 2015 | 269 | 85 | +184 |
| 2014 | 26 | 97 | −71 |
| 2013 | 158 | 157 | +1 |
| 2012 | 322 | – | +322 |
Whole web. Gained: websites that added KitchenAid that year after an earlier visit without it. Dropped: websites where it was gone that year and never found again.
Groups overlap: a country can count toward several (Germany is in Europe, the EU and DACH), so the shares don't add up to 100%.
| # | Website | Popularity | StackSpend | Country | TLD |
|---|---|---|---|---|---|
| 01 |
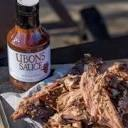 ubonsbbq.com |
449,879 | $1.64K+ | 🇺🇸 United States | com |
| 02 |
 heavenlyhomemakers.com |
668,084 | $2.23K+ | 🇺🇸 United States | com |
| 03 | thehappyhousie.com | 714,092 | $4.54K+ | 🇺🇸 United States | com |
| 04 |
 faithhopeloveandlucksurvivedespiteawhiskeredaccomplice.com |
768,601 | $3.03K+ | 🇺🇸 United States | com |
| 05 |
 rabbitandwolves.com |
850,368 | $6.94K+ | 🇨🇦 Canada | com |
| 06 |
 figandoliveplatter.com |
856,732 | $14.4K+ | 🇺🇸 United States | com |
| 07 |
 fleischmannsyeast.com |
1,037,432 | $603+ | 🇺🇸 United States | com |
| 08 |
 ablondesmoment.com |
1,047,634 | $451+ | 🇺🇸 United States | com |
| 09 |
 thecentsableshoppin.com |
1,050,748 | $722+ | 🇫🇮 Finland | com |
| 10 |
 sundpaabudget.dk |
1,113,085 | $1.44K+ | 🇩🇰 Denmark | dk |
| 11 | ethannevelyn.com | 1,192,637 | $13+ | 🇬🇧 United Kingdom | com |
| 12 |
 camelliabrand.com |
1,296,528 | $12.28K+ | 🇺🇸 United States | com |
| 13 |
 leannebrown.com |
1,374,077 | $1.75K+ | 🇺🇸 United States | com |
| 14 | dosaygive.com | 1,438,274 | $2.05K+ | 🇺🇸 United States | com |
| 15 |
 r-e-m-o.de |
1,440,575 | $235+ | 🇩🇪 Germany | de |
| 16 |
 sitetips.nu |
1,549,270 | $481+ | 🇸🇪 Sweden | nu |
| 17 |
 austinmoms.com |
1,556,240 | $4.12K+ | 🇺🇸 United States | com |
| 18 |
 coopcancook.com |
1,606,646 | $1.33K+ | 🇺🇸 United States | com |
| 19 | shockmunch.com | 1,638,913 | $137+ | 🇺🇸 United States | com |
| 20 | cindysrecipesandwritings.com | 1,727,332 | $595+ | 🇺🇸 United States | com |
This is 20 of 647 websites. Download up to 1M sites per list as CSV, enriched with firmographics.
| Company | Website | Employees | Industry | Country | Founded |
|---|---|---|---|---|---|
| Fisher Nutrition Systems: Professional… |
 fishernutritionsystems.com |
1-10 | computer software | 🇺🇸 United States | 2017 |
| L. H. Hayward & Co., Llc |
camelliabrand.com
|
11-50 | - | 🇺🇸 United States | - |
| KORE S.A |
 kore.gr |
201-500 | Manufacturing | 🇬🇷 Greece | 1979 |
| Asia24 GmbH | asia24-lifefood.de | - | - | 🇩🇪 Germany | - |
| We Care Pharmacy Network (pty) Ltd |
 we-care.co.za |
51-200 | information technology and services | 🇿🇦 South Africa | 2014 |
| Schweid & Sons |
 schweidandsons.com |
201-500 | Food and Beverage Manufacturing | 🇺🇸 United States | 1978 |
| Strawberry And Sage |
 silviabaldini.com |
1-10 | Hospitality | 🇺🇳 - | - |
| Liveng Proof - Group Fitness Bootcamps |
 livengproof.com |
11-50 | Wellness and Fitness Services | 🇺🇸 United States | - |
| My Whole Well-being |
 mywholewellbeing.com |
1-10 | - | 🇺🇸 United States | - |
| Quesería Menorquina |
 queseriamenorquina.com |
11-50 | Food and Beverage Services | 🇺🇳 - | - |
| You Like New |
 youlikenew.com |
1-10 | Travel Arrangements | 🇺🇸 United States | 2012 |
| S'dorf Stuebel | sdorf.fr | 11-50 | Restaurants | 🇫🇷 France | 2006 |
| Big King Salmon Charters |
 bigkingsalmoncharters.com |
1-10 | fishery | 🇺🇸 United States | - |
| Schmidt’s Meat Market |
 schmidtsmeatmarket.com |
11-50 | Food and Beverage Services | 🇺🇸 United States | - |
| Cookiss Bakery |
 cookissbakery.com |
1-10 | Restaurants | 🇮🇹 Italy | - |
| GloTIME |
 glotime.tv |
11-50 | Broadcast Media Production and Distribution | 🇺🇳 - | 2014 |
| Blue Fin IV Inc |
 bluefiniv.com |
1-10 | Fisheries | 🇺🇸 United States | - |
| Earth Dance Farm |
 earthdancefarm.net |
11-50 | Restaurants | 🇺🇸 United States | - |
| Southside Social, LLC |
 thesouthsidesocial.com |
11-50 | Restaurants | 🇺🇸 United States | 2014 |
| Live Simply Healthy |
 livesimplyhealthy.com |
1-10 | Wellness and Fitness Services | 🇨🇦 Canada | - |
| 1111 Light Lane |
 1111lightlane.com |
1-10 | - | 🇺🇸 United States | - |
| MiMi Foods - Artistic Dough Products |
 mimifoods.ca |
11-50 | Food Production | 🇨🇦 Canada | 2001 |
| Gluten Free School |
 glutenfreeschool.com |
1-10 | Wellness and Fitness Services | 🇺🇸 United States | - |
| Be Different Limited |
 be-different.co.uk |
11-50 | Advertising Services | 🇬🇧 United Kingdom | 2003 |
| Whiskey Consensus |
 whiskeyconsensus.com |
1-10 | Media Production | 🇺🇸 United States | 2017 |
| Flynn Orchards |
 flynnorchards.com |
11-50 | Farming | 🇺🇸 United States | - |
| Enfield Community Acupuncture |
 enfieldacupuncture.co.uk |
1-10 | Alternative Medicine | 🇬🇧 United Kingdom | - |
| Better Living Solutions |
 blscounseling.net |
11-50 | Mental Health Care | 🇺🇸 United States | 2014 |
| Cannabinoid Creations |
 cannabinoidcreations.com |
1-10 | - | 🇺🇸 United States | - |
| Feed Your Soul |
 feedyoursoul2.com |
11-50 | Food Production | 🇺🇸 United States | 2005 |
| Sioux Z Wow Sauce Co |
 siouxzwow.com |
1-10 | Food and Beverage Manufacturing | 🇺🇸 United States | - |
| It's Me, Tee |
 itsmetee.com |
1-10 | Marketing Services | 🇺🇸 United States | 2013 |
| Open Sky Fitness |
 openskyfitness.com |
1-10 | Wellness and Fitness Services | 🇺🇸 United States | - |
| Cooperativa De Consum |
 canpujades.org |
1-10 | - | 🇪🇸 Spain | - |
| OneWholesomeMeal |
 onewholesomemeal.com |
1-10 | Food and Beverage Services | 🇭🇰 Hong Kong | 2018 |
| Abma's Farm, Inc. |
 abmasfarm.com |
1-10 | Accounting | 🇺🇳 - | - |
| Suzie Turcotte |
 suzieturcotte.com |
1-10 | - | 🇨🇦 Canada | - |
| Austin Moms |
austinmoms.com
|
1-10 | Book and Periodical Publishing | 🇺🇸 United States | 2011 |
| Co Springs Mom Collective |
 cospringsmom.com |
1-10 | Advertising Services | 🇺🇸 United States | 2015 |
| Mette Brahm Ernæringsterapi | mettebrahm.dk | 1-10 | Health, Wellness & Fitness | 🇩🇰 Denmark | 2018 |
A sample of enriched company profiles. Full exports include company, social, and spend signals on every domain.
All 647 of these sites already run KitchenAid, with the food and beverage services segment leading at 6 sites. Pitch the products and services that fit that exact stack.
Selling FeedBurner, Feedly, or another Content Aggregation product? These 647 KitchenAid users are your displacement audience, filterable by country and company size.
Top markets for KitchenAid: United States (64.9%), Germany (4.6%), United Kingdom (4.6%). Size the Content Aggregation market by geography before you build or invest.
Free for non-profits, academia & data journalists - non-commercial and public-interest use, on request.
Request accessUnlock KitchenAid and download unlimited filtered reports for a month: up to 1M sites per list, segmented by country and TLD.
No contracts, cancel anytime · Instant access after checkout · Data point availability varies by website and report